Centre for Population analysis of the National, state and territory population publication from the Australian Bureau of Statistics (ABS)
Reference period: -
The Estimated Resident Population of Australia grew by 0.6 per cent in the June 2023 quarter, to be 2.4 per cent higher than a year earlier, in line with the 2023-24 MYEFO forecast.
This growth was driven by a net inflow of 518,000 migrants over the year to June 2023, including 122,000 in the quarter, with continued strength in arrivals and continued weakness in departures. Net overseas migration contributed 0.5 percentage points of the quarterly population growth and 2.0 percentage points of annual growth.
Population growth over the year to 30 June 2023 was as forecast in the 2023-24 MYEFO, and the population as of 30 June was a modest 3,700 people lower than forecast.
Natural increase (births minus deaths) fell to 106,000 over the year to June 2023, a decrease of 15.4 per cent from the previous year. This was driven by an increase in deaths (3.6 per cent) and a fall in births (-4.1 per cent).
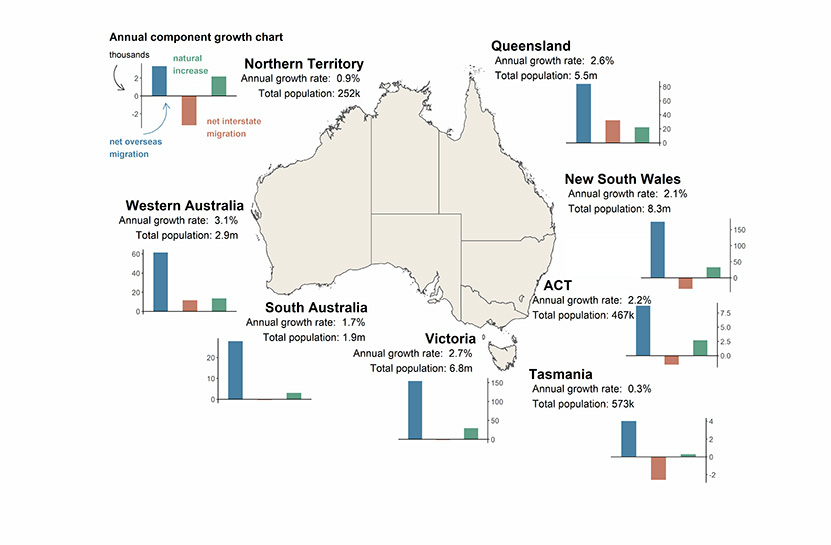
Western Australia had the fastest growing population over the year to June 2023 at 3.1 per cent, followed by Victoria (2.7 per cent) and Queensland (2.6 per cent). Tasmania (0.3 per cent) and Northern Territory (0.9 per cent) were the slowest growing jurisdictions.
The annual number of interstate moves was 21.9 per cent below the same period in 2019. Net moves to regional areas increased in the June 2023 quarter and are back around levels seen over 2018.
National population
- Australia’s population grew by 624,000 people over the year to June 2023, an increase of 2.4 per cent. This is the largest annual increase in the number of people on record and the highest growth rate since the 1950s.
- Population in the June 2023 quarter grew by 147,000 people or 0.6 per cent, driven by net overseas migration, while natural increase was still relatively low (Chart 1).
- NOM was 122,000 in the June 2023 quarter and 518,000 over the year to June 2023, which drove most of the annual population growth.
- This was the largest annual net inflow of overseas migrants on record, reflecting both higher migrant arrivals and subdued departures (Chart 2). Higher NOM has been driven by higher temporary migration, especially higher arrivals of international students, and fewer departures across most temporary visa groups.
- Over the four quarters to March 2023, the ABS preliminary NOM estimates were revised up by a combined 19,000 persons.
- Natural increase was 106,000, falling by 19,000 (15.4 per cent) over the year to June 2023.
- Natural increase peaked at 163,000 in the year ending December 2012, and has since declined by 35 per cent.
- There were 190,000 deaths over the year to June 2023, an increase of 3.6 per cent from the previous year.
- This period featured peaks in deaths due to COVID-19 and other causes (also see ABS Provisional Mortality Statistics release).
- There were 296,000 births over the year to June 2023, a decrease of 4.1 per cent.
- The preliminary estimate of Australia’s total fertility rate (TFR) for 2022-23 was 1.58 babies per woman. This figure will be subject to revision in future editions of the release.
- Quarterly interstate moves were 91,000 in the June 2023 quarter, down from 95,000 in the March 2023 quarter. Interstate moves remain significantly below pre‑pandemic levels, with June 2023 quarter moves 24 per cent lower than the June 2019 quarter.
- The number of annual interstate moves fell to 372,000 over the year to June 2023 (Chart 3), down from a record high of 509,000 over the year to March 2022.
- However, it is unlikely all recorded interstate moves actually occurred in the year to March 2022. Interstate moves are estimated using change of address data captured through Medicare, which saw an unprecedented increase due to widespread updating of Medicare records as people received vaccinations for COVID‑19, particularly in the June to December 2021 quarters.
- The number of annual interstate moves fell to 372,000 over the year to June 2023 (Chart 3), down from a record high of 509,000 over the year to March 2022.
State and territory population
- Compared to the March quarter 2023, annual population growth increased in all states and territories except Tasmania (Chart 4). New South Wales, Victoria and South Australia all had their fastest annual growth in the series’ history (which begins in June 1981), while Queensland and Western Australia had their fastest annual growth in the last decade.
- Western Australia was the fastest growing jurisdiction in the year to June 2023, driven by high overseas migration. Victoria was second fastest growing jurisdiction in that period, growing slightly faster than Queensland.
- Population growth across all jurisdictions was largely driven by high overseas migrant arrivals and subdued migrant departures over the year to June 2023 (Chart 5).
- Tasmania and the Northern Territory were the slowest growing jurisdictions over the year to June 2023 due to interstate migration outflows and a comparatively smaller share of net overseas migration.
- In Tasmania, natural increase only contributed 0.05 percentage points to annual population growth, down from 0.15 percentage points last year. Natural increase contributed 0.9 percentage points to annual population growth in the Northern Territory, the largest for any state or territory.
- Although the Northern Territory historically experienced interstate migration outflows, Tasmania has in recent history generally had interstate migration inflowsrather than outflows.
- Queensland maintained the largest net inflow of internal migrants over the year to June 2023, with Western Australia the only other state to record a net inflow.
- There were smaller annual net interstate migration (NIM) outflows for New South Wales, Victoria and the Australian Capital Territory compared to a year earlier. Tasmania, South Australia and the Northern Territory all recorded falls in net interstate migration over the same period.
Regional internal migration
- Net internal migration to regions outside capital cities was 7,300 in the June 2023 quarter, an increase of 1,700 from the March quarter, but down from a peak of 12,000 in the March 2021 quarter (Chart 6).
- The increase over the quarter was driven by a fall in the number of departures from regions to capital cities, while the number of capital city residents moving to regions was relatively unchanged.
| State | ERP | ERP Increase | ERP Increase | Natural Increase | NIM | NOM |
|---|---|---|---|---|---|---|
| 30 June 2023 |
Since 30 June 2022 |
annual % | annual contribution |
annual contribution |
annual contribution |
|
| NSW | 8,339,000 | 173,000 | 2.1 | 33,000 | -34,000 | 174,000 |
| VIC | 6,812,000 | 182,000 | 2.7 | 29,000 | -1,900 | 154,000 |
| QLD | 5,459,000 | 138,000 | 2.6 | 22,000 | 32,000 | 84,000 |
| SA | 1,852,000 | 30,000 | 1.7 | 3,000 | -400 | 28,000 |
| WA | 2,879,000 | 87,000 | 3.1 | 14,000 | 12,000 | 62,000 |
| TAS | 573,000 | 1,700 | 0.3 | 300 | -2,600 | 4,000 |
| NT | 252,000 | 2,200 | 0.9 | 2,200 | -3,300 | 3,300 |
| ACT | 467,000 | 9,900 | 2.2 | 2,700 | -1,600 | 8,800 |
| Australia* | 26,639,000 | 624,000 | 2.4 | 106,000 | NA | 518,000 |
* Includes other territories comprising Jervis Bay Territory, Christmas Island, the Cocos (Keeling) Islands and Norfolk Island
| Release | Former catalogue | Release date |
|---|---|---|
| Overseas migration, 2022–23 | N/A | 15/12/2023 |
| National, state and territory population, September 2023 | 3101.0 | 21/03/2024 |
| National, state and territory population, June 2023 | 3101.0 | 14/12/2023 |
| Regional population, 2022–23 | 3218.0 | 26/03/2024 |
NOTES
Further detail is available from the ABS in National, state and territory population, June 2023.
Downloads
National, state and territory population, June 2023 PDF 488 kB
National, state and territory population, June 2023 DOCX 302 kB